
Learn how to pass Core Web Vitals for your Magento store in 2026. Covers LCP, INP, CLS optimization, Hyvä Theme benchmarks and monitoring tips.
The 3 Core Web Vitals in 2026 are LCP (≤ 2.5 seconds), INP (≤ 200 milliseconds — replaced FID in March 2024), and CLS (≤ 0.1). Magento's biggest challenge is INP because of its heavy JavaScript stack. 43% of sites still fail the INP threshold. The fastest path to passing CWV is migrating your frontend to Hyvä Theme. For a detailed analysis of what's holding your specific store back, start with our free Magento Performance Audit.
What Are Core Web Vitals?
Core Web Vitals are 3 metrics that Google uses to measure real user experience on websites. Since August 2021, these scores are ranking factors in Search. They show how quickly page content loads, how quickly a browser can respond to a user's input throughout their visit, and how stable the content is as it loads.
The current Core Web Vitals in 2026:
- Largest Contentful Paint (LCP) — tracks loading speed. How long do users have to wait until they see meaningful content on the website.
- Interaction to Next Paint (INP) — measures responsiveness to all user interactions throughout the entire page visit (click button, add product to cart, search, select options, log in, etc).
- Cumulative Layout Shift (CLS) — tracks visual stability. How much unexpected content movement occurs while the page loads.
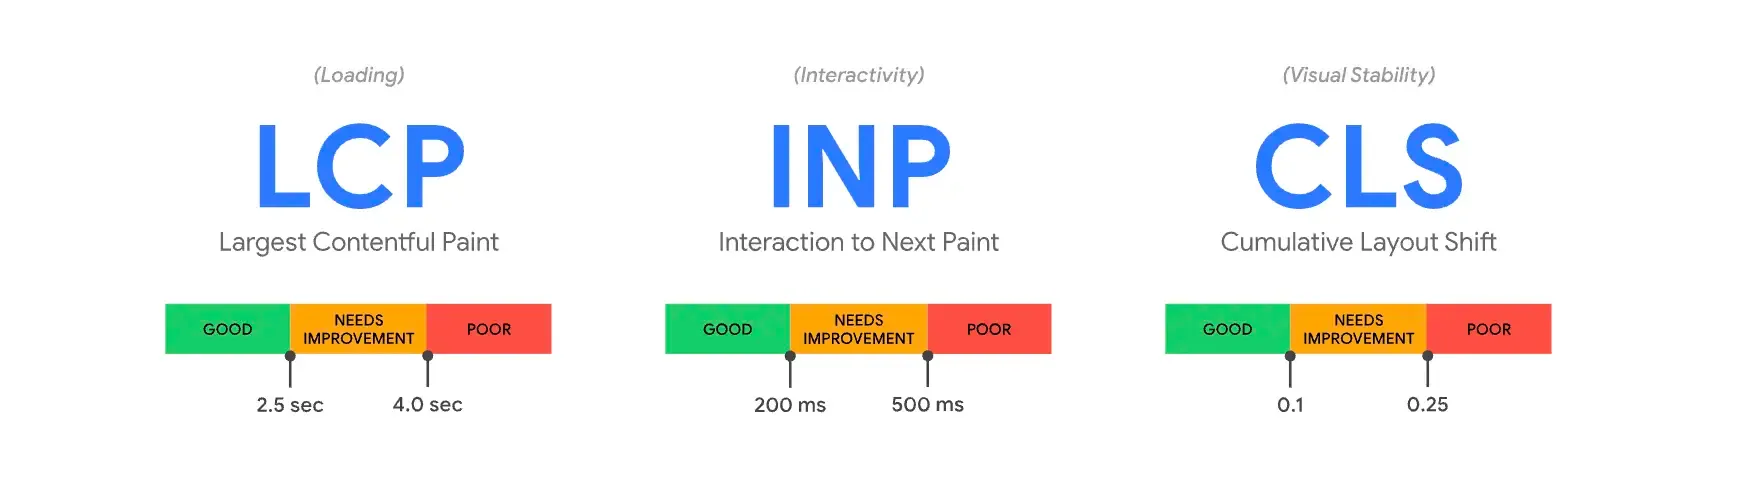

To pass the Core Web Vitals assessment, you need to score "good" for all three metrics — based on field data from real users.
Why Core Web Vitals Still Matter in 2026
When we first published this guide in 2021, Core Web Vitals had just launched as a ranking signal. Five years later, their importance has only grown. Google continues to increase the weight of page experience in search rankings.
The business case is clear:
- Sites passing all three CWV thresholds see measurably better organic rankings, ~24% lower bounce rates, and higher user engagement.
- A 1-second delay in page load reduces conversions by 7%.
- According to the 2025 Web Almanac, only 48% of mobile pages pass all three Core Web Vitals. That means more than half the web is failing on mobile — and if your Magento store is among those passing, you have a competitive edge.
"At Google Search, our mission is to help users find the most relevant and quality sites on the web. The goal with these updates is to highlight the best experiences and ensure that users can find the information they're looking for." Source
So it's not only about ranking. If you lose your position on Search to your competitor, it also means that competitors provide a better experience for the customer who could be yours.
How to Measure Core Web Vitals
There are a bunch of tools to measure Core Web Vitals:
Field tools (real user data — this is what Google uses for ranking)
- Chrome User Experience Report (CrUX) — Google's public dataset of real user experience metrics
- PageSpeed Insights — aggregates data from Lighthouse and the CrUX report
- Search Console (Core Web Vitals report) — shows site-wide CWV status
- web-vitals JavaScript library — a modular library that measures all the Web Vitals on real users
- RUMvision — real user monitoring built specifically for eCommerce (more on this below)
Lab tools (simulated/controlled environment)
- Lighthouse — built into Chrome DevTools
- Chrome DevTools — Performance panel for deep-dive analysis
- WebPageTest — advanced performance testing with filmstrip view and waterfalls
Field and lab combined
- Web Vitals Chrome extension — shows CWV metrics in real-time as you browse
That's better to use multiple field and lab tools. Because, for instance, Lighthouse results change based on the environment it is running in, performance of your PC and on numerous other factors, such as the network conditions of the servers hosting, etc. So running benchmarks, make sure your PC is not occupied with other CPU heavy tasks.
Workflow to Optimize Core Web Vitals
Measure → Optimize → Monitor
1) Measure — identify pain points
- CrUX Dashboard to measure the health of your website.
- Search Console to identify pages that need attention.
- PageSpeed Insights to deep dive on user experience metrics for a specific page.
2) Optimize — debug and optimize pages that need attention
- Lighthouse to audit a page and uncover improvements.
- Web Vitals extension to analyze Core Web Vitals metrics in real-time on a page.
- Chrome DevTools to debug performance issues and test code changes.
3) Monitor — continuously monitor and prevent regression
- RUMvision for continuous real-user monitoring with eCommerce-specific insights.
- CrUX API, PSI API and web-vitals.js to automate real user data collection and build alerting systems.
- Lighthouse CI to automate lab tests and prevent regressions in your CI/CD pipeline.
Field Data vs Lab Data: What Google Actually Uses
It's important to understand that for Google ranking, only field data matters — data gathered from real users through the Chrome User Experience Report. Lab data metrics are gathered from a controlled environment. It can be measured even if you develop the project on a local machine. And it's handy, as you can monitor changes during development. You can predefine device and network connections.
Indeed there's a strong correlation between Lighthouse scores (lab data) and Core Web Vitals scores based on field data (real-user or RUM data). But the fact that so many pages with perfect Lighthouse scores still see real-user performance issues is a clear indicator that lab tools have blind spots.
Commonly people think about website performance as a single number — Lighthouse score — rather than a distribution of values (representing distinct user visits) that vary and fluctuate constantly.
So take statements like "My site loads in less than 1 second!" skeptically, without additional details, they are just empty bragging. Indeed!
Google considers the Core Web Vitals metric as "good" if 75% of people on your website experience a good result (the 75th percentile). But Lighthouse simulates a user's experience on a mid-tier mobile on a slow 4G connection, and that might not represent 75% of your real users.
For instance, the web store home page of our client grasscity.com passes the Core Web Vitals assessment while the Lighthouse score isn't "green".
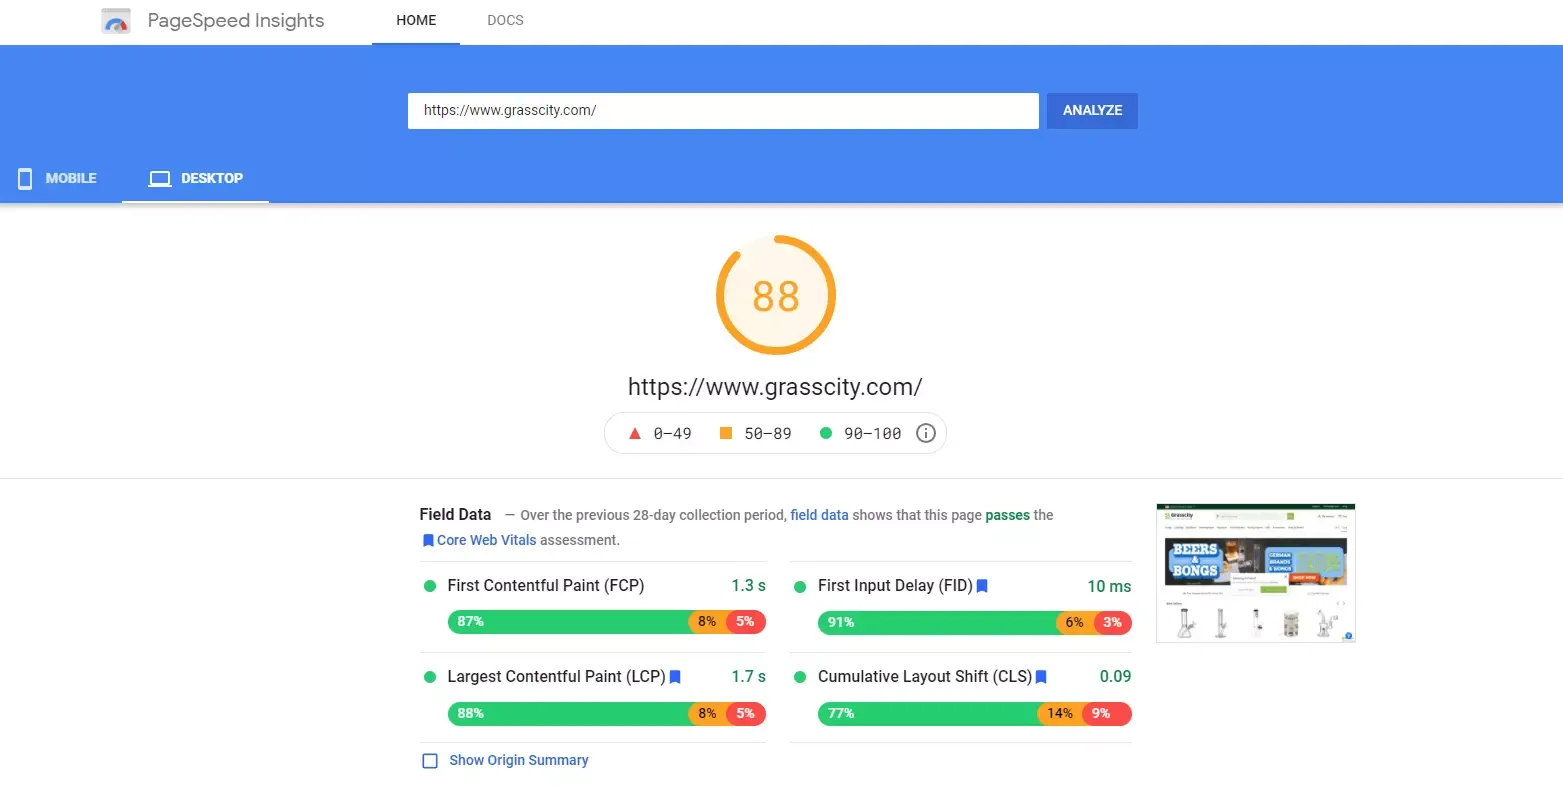
And again, only scores based on field data matter. Why lab and field data can be different read here.
What Impacts Core Web Vitals?
LCP hurts by:
- Slow server response times
- Render-blocking JavaScript and CSS
- Resource load times (especially image and video files)
- Client-side rendering
INP hurts by:
- Long JavaScript tasks that block the main thread
- Excessive DOM size that slows down rendering
- Inefficient or complex event handlers
- Heavy third-party scripts (analytics, A/B tests, chat widgets)
- Large JavaScript bundles and RequireJS overhead (common in Magento Luma)
CLS hurts by:
- Ads causing any change in layout
- Cookie banners/consent management platforms
- Images without explicit dimensions (width and height)
- Dynamically injected content
- Embeds and iframes without dimensions
- Web fonts causing FOIT/FOUT
1. LCP (Largest Contentful Paint)
LCP is a user-centric metric that measures perceived load speed. It marks the point in the page load timeline when the main content (image, video, element with image background loaded via the url() function, text block) has likely loaded. The time when the most meaningful contentful paint on the page becomes ready to digest.
1.1. What Is a Good LCP Score?
Sites should strive to have LCP of 2.5 seconds or less. At the 75th percentile, segmented across mobile and desktop devices.

According to the 2025 Web Almanac, only 62% of mobile pages achieve a good LCP, making it the hardest Core Web Vital to pass overall.
High LCP score means that users will sooner get the content, understand it's useful, and stay on the website. It may decrease the bounce rate.
1.2. What Element Is Considered LCP?
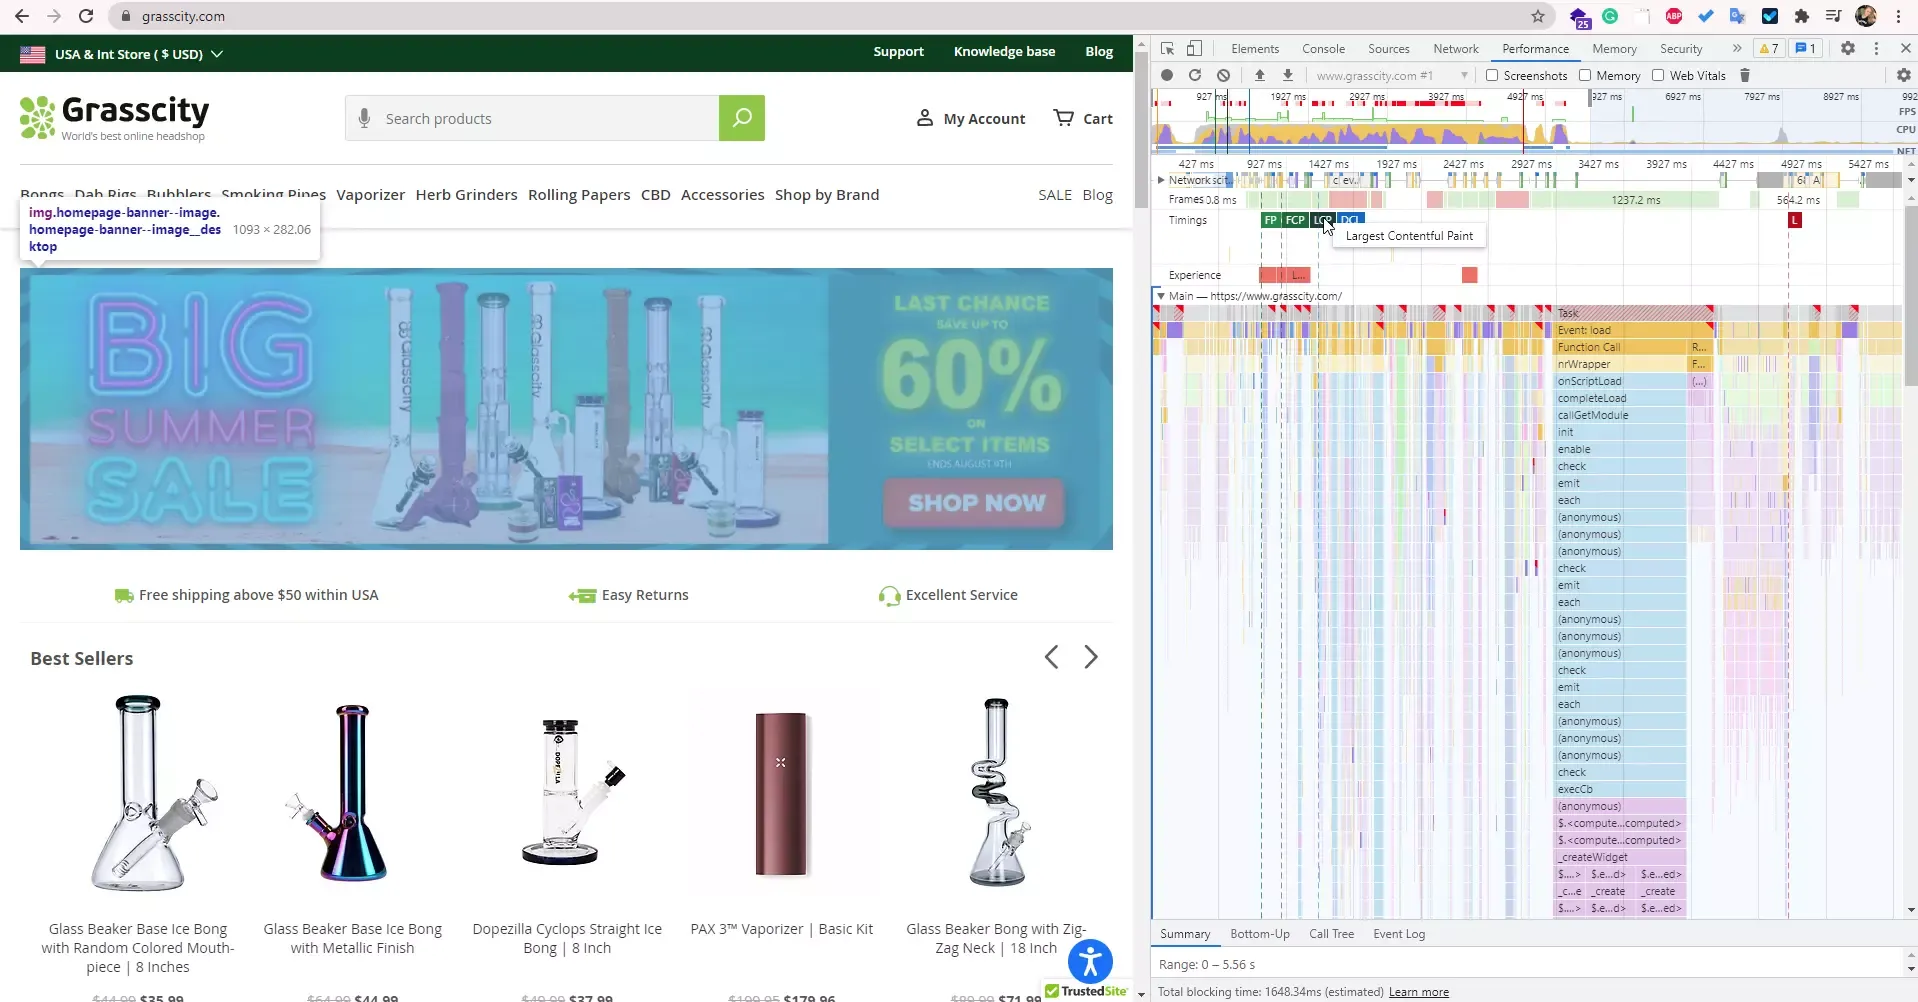
You can find the Largest Contentful Paint HTML Element using Chrome DevTools (Performance tab):
- Open Chrome DevTools in Chrome
- Select the device type or Responsive and set the dimensions
- Click on the Performance Tab
- Reload the page and start a recording
- Wait until the recorded profile is loaded
- Mouse over the LCP icon on timing — it will highlight the LCP element on the page
Website Image Analysis Tool on Cloudinary Website Speed Test detects the LCP element on the page, its time to load, and potential optimization that can be implemented.
Or in PageSpeed Insights go to the Diagnostics Area and look for the LCP element.
1.3. What Affects LCP?
- Slow server response times (TTFB)
- Render-blocking JavaScript and CSS
- Slow resource load times (especially images)
- Client-side rendering (common in PWA solutions)
1.4. How to Improve LCP for Magento Store
1.4.1. Slow Server Response Times
The longer that it takes a browser to receive content from the server, the longer that it takes to render anything on the screen.
If the impact of server response time is significant, you'll see it in Lighthouse audit — "Reduce initial server response time".
- Optimize the server's application logic to render pages faster.
- Optimize how your server queries databases, or migrate to faster database systems.
- Upgrade your server hardware to have more memory or CPU.
- Use servers locally close to your customers. If you are running your web store in multiple countries — transfer the site to the nearest server.
- Cache static files using Varnish.
- Use CDN for static files.
There is no one-size-fits-all solution. The correlation of site visitors from different countries and the physical server location matters. You can try to cache static files using Varnish if site visitors are primarily from one region.
Hosting configuration is crucial for Magento 2 performance. If you don't know how to configure it on your own or don't have time and resources to support and maintain servers, choose a hosting solution that is already optimized for Magento like Hypernode, Cloudways, or MageMojo. If you want a hands-on walkthrough, we have a guide on how to deploy the latest Magento Open Source with Hyvä Theme on DigitalOcean in 15 minutes.
1.4.2. Render-Blocking JavaScript and CSS
Render-blocking resources such as JavaScript or CSS cause significant delays in page loading. This type of performance issue is identified in Lighthouse — "Eliminate render-blocking resources".
To reduce the time it takes for a browser to execute JavaScript and respond to user interactions, you need to reduce the number of JavaScript files on a page:
- JavaScript bundling — a technique that combines multiple files to reduce server requests. Magento 2 has a built-in bundler, but it's ineffective: instead of reducing requests, it creates a huge JavaScript file with all possibly needed JavaScript on any page. Use alternatives like Magepack.
- Deferred non-critical JavaScript loading — Use
asyncordeferfor non-critical scripts. - Move non-critical JavaScripts to the bottom — Leave just critical scripts at the top, move all others to the bottom so the browser can process page load more efficiently.
- Defer non-critical CSS — Enable "CSS Critical Path" on Magento Admin Panel to defer all non-critical CSS files.
- Minify and Merge CSS — via Magento Admin Panel: Stores → Configuration → Advanced → Developer → CSS Settings.
- Inline critical CSS — So the browser can start painting the page without waiting for external CSS files.
Or, the most impactful solution: migrate your frontend to Hyvä Theme. Hyvä eliminates RequireJS, Knockout, and UIComponents entirely, reducing JavaScript from 200+ files (1.5 MB) to just 2 files (~0.2 MB). This alone solves most render-blocking issues.
1.4.3. Slow Resource Load Times
For many websites, images are the largest element in view when the page has finished loading. Optimize them.
Optimize your images and videos:
Images account for ~42% of the Largest Contentful Paint element for websites.
- Choose the proper image format — Use modern formats: WebP and AVIF. AVIF provides even better compression than WebP (up to 50% smaller files) and is now supported in all major browsers. There are several modules for Magento that convert images to WebP: Magento 2 module for WebP by Yireo, Magento 2 WebP Images Extension by Magefan.
- Use
fetchpriority="high"on the LCP image — This is a newer attribute (2023+) that tells the browser to prioritize downloading the LCP image immediately:<img src="hero.webp" fetchpriority="high" alt="...">. This can improve LCP by 100–400ms with zero effort. - Compress images — Tools: ImageOptim, TinyPNG, Cloudinary.
- Serve responsive images — Use
srcsetandsizesattributes so the browser downloads the appropriate size for each device. - Replace animated GIFs with video for faster page loads.
- Use image CDNs — Services like Cloudinary or Cloudflare Images optimize on the fly.
Optimize your fonts:
- Subset fonts — Most fonts contain character sets your site doesn't use. Tools: Font Squirrel, Glyphhanger.
- Use variable fonts — One variable font file is lighter than several font style files.
- Host fonts on your server — It performs better to have fonts on the same domain.
- Use
font-display: swap— So text is visible immediately in a fallback font while the custom font loads.
Preload important resources:
Use <link rel="preload"> to prioritize critical assets: fonts, above-the-fold images, and critical CSS. This allows the browser to render the visible part of the page immediately.
1.4.4. Client-Side Rendering
Client-side rendering renders web pages in the browser using JavaScript. That's how PWAs work. They utilize client-side JavaScript logic and progressive libraries such as Vue.js or React.js for Magento. But it has a significant influence on LCP since the browser must first load all critical JavaScript before it can finish rendering.
If you are already using a headless PWA approach, server-side rendering (SSR) should be implemented. Using SSR and CSR simultaneously is now standard practice. If you're considering a headless approach for Magento, see our guide on Alokai (Vue Storefront) development.
But for most Magento stores, the simplest solution is Hyvä Theme — it's not headless, not PWA. It's a modern Magento-native theme that achieves better performance than most headless solutions with a fraction of the complexity.
1.4.5. Don't Use Lazy Loading for LCP Element
Lazy Loading may seem like a silver bullet, and it's a typical trick to improve perceived performance. But if you apply it to LCP elements, that can shoot your LCP score. Lazy Loading defers downloading a resource until it's needed, which conserves data. But it replaces above-the-fold images with placeholders.
Lazy Loading works perfectly for elements that are out of view while the page is rendering, but critical resources above the fold should be loaded with the standard <img> element (with fetchpriority="high" and NO loading="lazy") so they're displayed as soon as possible.
1.4.6. Lazyload Images and Iframes Natively
If you are using lazy loading for images and iframes, do it natively with loading="lazy" as third-party lazy loading JS libraries overwhelm the main thread and can contribute to INP problems.
2. INP (Interaction to Next Paint)

Interaction to Next Paint (INP) measures how quickly your page responds to all user interactions throughout their entire visit — not just the first click, but every click, tap, and keyboard input. The browser must process the event handlers and then paint visual feedback. INP captures the full latency: from user action to the next frame painted on screen.
INP is composed of three parts:
- Input Delay — how long the browser waits before it can start processing event handlers (usually because the main thread is busy with other tasks)
- Processing Time — how long the event handler callbacks take to execute
- Presentation Delay — how long it takes from when event handlers finish to when the browser paints the next frame
2.1. What Happened to FID?
Google introduced First Input Delay (FID) as the original responsiveness metric in 2020. But FID only measured the delay of the first interaction on the page — it completely ignored everything that happened after. A page could have great FID but become unresponsive later when users tried to add products to cart, apply filters, or navigate.
Google introduced INP as an experimental metric in 2022, announced it as a pending replacement in 2023, and officially replaced FID with INP on March 12, 2024. FID is now deprecated and removed from Google Search Console, PageSpeed Insights, and all CWV assessment tools.
If you were already passing FID, don't assume you'll pass INP. On mobile, INP scores tend to be significantly worse than FID — some analyses show mobile INP is 35% worse than FID on average. This is particularly challenging for Magento stores with complex product pages, layered navigation, and add-to-cart interactions.
2.2. What Is a Good INP Score?
- Good: ≤ 200 milliseconds
- Needs Improvement: 200–500 milliseconds
- Poor: > 500 milliseconds

43% of websites still fail the 200ms INP threshold, making it the most commonly failed Core Web Vital in 2026. For Magento stores running the default Luma theme with RequireJS and Knockout.js, the situation is often even worse.
2.3. What Affects INP?
- Long JavaScript tasks that block the main thread — the #1 cause. The browser can't respond to user clicks while it's executing a 300ms JavaScript task.
- Heavy third-party scripts — analytics, A/B testing tools, consent management platforms, chat widgets, recommendation engines. Each one competes for main thread time.
- Excessive DOM size — large DOMs slow down rendering and interaction. Aim for fewer than 1,500 nodes, with maximum depth under 32 levels.
- Complex event handlers — unoptimized handlers for clicks, scrolls, and input events that trigger expensive computations or forced synchronous layouts.
- Magento Luma's JavaScript architecture — RequireJS, Knockout.js, and UI Components create a cascade of JavaScript execution that competes with user interactions throughout the entire session.
2.4. How to Improve INP for Magento Store
2.4.1. Break Up Long Tasks
The main thread can only do one thing at a time. If a JavaScript task takes 300ms, the browser can't respond to user interactions for that entire duration. Break long tasks into smaller chunks:
- Use
setTimeout()orrequestAnimationFrame()to yield back to the main thread periodically. - Use
scheduler.yield()(available in modern browsers) for even better task scheduling. - Use web workers for heavy computations that don't need DOM access (like AJAX calls, data processing).
2.4.2. Reduce the Impact of Third-Party Scripts
Analytics services, A/B tests, social media embeds, chat services, personalized product recommendations — all compete for main thread time. Each third-party script on your product page adds to INP.
- Audit all third-party scripts — use Chrome DevTools Performance panel to see which scripts block the main thread during interactions.
- Use facades — replace heavy embeds with lightweight placeholders until the user interacts. Lite-youtube-embed is 224 times faster than the full YouTube player.
- Defer non-critical third-party scripts — load analytics and marketing scripts after the page is interactive.
- Lazy-load chat widgets, review widgets, and recommendation carousels — hide behind a "Load Reviews" button or trigger on scroll.
Over 50% of users abandon a website if it takes longer than 3 seconds to load. So unnecessary third-party code may harm your business more than the benefits you can get from its usage.
2.4.3. Reduce JavaScript Execution Time
- Only send the code that your users need by implementing code splitting.
- Remove unused JavaScript — audit your Magento extensions, many load JavaScript on every page even when they're not needed.
- Use the PRPL pattern (Push, Render, Pre-cache, Lazy-load) for caching.
2.4.4. Minimize DOM Size
Large DOM trees slow down rendering and interaction. Every time the browser needs to recalculate styles or layout after a user interaction, a bigger DOM takes longer.
- Audit your Magento theme templates and simplify complex layouts.
- Don't over-complicate product page layouts with deeply nested containers.
- Consider the impact of mega-menus, layered navigation, and footer widgets on DOM size.
2.4.5. Use Hyvä's x-defer for Alpine.js Components
If you're running Hyvä Theme (version 1.3.7+), take advantage of the x-defer plugin. It delays initialization of Alpine.js components on the page, reducing JavaScript execution during critical interaction periods. This directly improves INP.
Combined with Speculation Rules for preloading, these two features can significantly boost your CWV scores with literally a few clicks in the Hyvä admin panel.
2.4.6. Optimize Event Handlers
- Debounce or throttle frequent events like scroll, resize, and input field changes.
- Use passive event listeners where possible:
addEventListener('scroll', handler, { passive: true }). - Avoid forced synchronous layouts — don't read layout properties (like
offsetHeight) immediately after writing to the DOM.
3. CLS (Cumulative Layout Shift)
Cumulative Layout Shift (CLS) measures the visual stability of visible content on the page. It quantifies unexpected layout shifts — annoying content moves that distract user experience.
CLS measures the largest burst of layout shift scores for every unexpected layout shift that occurs during the entire lifespan of a page, including while users scroll down.
Layout shifts occur when existing elements change their start position. A new element added to the DOM or an existing element resize — don't count as a layout shift. Only unexpected layout shifts are bad. If it's an expected reaction to user interaction (clicking a link, pressing a button, typing in a search box) and it occurs within 500 milliseconds of user input, it won't count in CLS calculation.
3.1. What Is a Good CLS Score?
A good CLS score is 0.1 or less. A score above 0.25 may negatively affect rankings — a definite sign that users are suffering from poor experience on the page.

3.2. What Affects CLS?
- Images without dimensions
- Ads, embeds, iFrames without dimensions
- Web Fonts causing FOIT/FOUT
- Dynamically injected content (banners, notification bars, consent management tools)
- Loading CSS for visible content
Content shifts, as a rule, happen because elements are loading asynchronously or DOM elements are dynamically added to the page above existing content.
The tricky thing with CLS is that in development, shifts may not occur because images and other content are already cached in the developer's browser. As well as APIs locally can run much faster than in production. Thus delays aren't noticeable for developers. At the same time, real users may have the opposite experience.
So it's crucial to monitor CLS metric for real users in the field. If you can't wait for 28 days to see in CrUX report if implemented updates affect real user experience, use a RUM tool like RUMvision or the web-vitals JavaScript library to measure CLS on real users in near real-time.
3.3. How to Improve CLS for Magento Store
3.3.1. Always Include Width and Height Attributes on All Images and Video Elements
Explicit element sizes help the browser allocate the correct amount of space in the document while the image is loading. So when the element is loaded, it won't push other elements on the page.
Magento includes width and height attributes on product images. But don't forget to specify explicit dimensions for all other images — CMS blocks, banners, blog post images, category headers.
Modern approach: use CSS aspect-ratio property as a complement to width/height: aspect-ratio: 16 / 9;. This ensures the browser reserves space even before dimensions are calculated.
3.3.2. Reserve the Required Space for Embeds (Pseudo Element Tactic)
Reserve the necessary space for elements that will be rendered later with CSS aspect ratio boxes to allow the browser to allocate the correct amount of space. Calculate required space and reserve it, for instance, by setting the min-height of the wrapper where the element (menu, banner, carousel, etc.) should be displayed later.
3.3.3. Never Insert Content Above Existing Content
...except in response to a user interaction. This ensures any layout shifts that occur are expected. If you have to add something above the existing element, consider using position: absolute or fixed.
This is especially relevant for Magento stores that dynamically inject cookie consent banners, promotional bars, or notification messages at the top of the page.
3.3.4. Use transform Animations
Prefer transform animations to animations of properties that trigger layout changes. Changing transform does not trigger any geometry changes or painting, which is very good. This means the operation can likely be carried out by the compositor thread with the help of the GPU.
3.3.5. Preload Fonts, Optimize Them and Host Internally
Custom fonts are important for marketing. They are part of brand identity. But custom fonts have different letter sizes and spacing than default fonts. And it takes more time to load, parse and render them, so at first, content displays in the default font and then transforms into custom. If it happens improperly, it produces layout shifts.
How to prevent layout shifting caused by custom fonts:
- Preload fonts —
<link rel="preload" href="/fonts/custom.woff2" as="font" type="font/woff2" crossorigin> - Use
font-display: swap— shows text immediately in a fallback font - Host fonts locally — avoid Google Fonts or other external font services that add extra DNS lookups and connections
- Turn icon fonts into SVG — icon font files are large, download slowly, and can't have explicit size attributes. SVG icons download faster and don't shift content.
- Use Critical CSS — inline the minimum CSS needed to render above-the-fold content
Hyvä Theme: The Fast Path to Passing Core Web Vitals
Throughout this guide, we keep coming back to the same point: Magento's default Luma theme is the root cause of most CWV failures. And the data backs this up.
We've conducted our own Luma vs Hyvä Magento performance test. On two identical DigitalOcean droplets with the same Magento installation, no additional modules, Hyvä was 4-5 times lighter than Luma. The numbers speak for themselves:
- Luma loads 200+ JS/CSS resources (~1.5 MB)
- Hyvä loads just 2 files (~0.2 MB)
- 58% of Hyvä stores pass Google's Core Web Vitals, compared to an industry average well below 20%
Hyvä's creator Willem Wigman removed RequireJS, Knockout.js, and UIComponents — replacing them with Alpine.js and Tailwind CSS. The result is a frontend that loads faster, responds to interactions faster (better INP), and produces fewer layout shifts.
If you're serious about passing Core Web Vitals without spending months fine-tuning Luma, Hyvä Theme development is the fastest path. And with Hyvä now open source and free, the barrier to entry has never been lower.
As a Hyvä Silver Partner, Eltrino can handle the migration from Luma to Hyvä, carefully adapting your existing design, functionality, and third-party integrations to work seamlessly with the new theme.
Performance Monitoring: Real User Data That Matters
Passing Core Web Vitals isn't a one-time achievement — it's an ongoing process. Every new deploy, every added script, every marketing campaign with new tracking pixels can cause regression. You need continuous monitoring with real user data.
Why CrUX Alone Isn't Enough
Google's Chrome User Experience Report (CrUX) is the authoritative source for CWV assessment, but it has a significant limitation: it uses a 28-day rolling average. That means if a deploy breaks your INP on Tuesday, you won't see it reflected in CrUX data for up to 4 weeks. By then, you've already lost rankings and conversions.
RUMvision: Real User Monitoring for eCommerce
RUMvision is a Real User Monitoring solution built specifically for eCommerce stores, including Magento and Hyvä. Unlike CrUX's 28-day delay, RUMvision shows performance data in near real-time — within hours, not weeks.
What makes RUMvision particularly useful for Magento stores:
- Real-time CWV monitoring per template — see how your homepage, product pages, category pages, and checkout each perform separately
- Third-party script impact analysis — visualize and benchmark the impact of chatbots, consent management platforms, heatmaps, and A/B tests on your visitors' INP and LCP scores
- Per-user-segment analysis — understand how different devices, browsers, and connection speeds affect the experience
- Deploy monitoring — see within hours if your new code performs as expected. If it doesn't, fix it before it affects your 28-day CrUX window
As the RUMvision team themselves put it: only 17% of Magento 2 sites have good Time to First Byte (compared to 88% of Shopify sites). But the good news is that with proper frontend optimization — especially with Hyvä — you can still recover and pass all three Core Web Vitals.
Other RUM Tools Worth Considering
- web-vitals.js — Google's open-source library. Free, lightweight, but requires your own infrastructure to collect and visualize data.
- SpeedCurve — recently launched a Magento 2 module for easy RUM integration.
- New Relic — included with Adobe Commerce Cloud. Good for backend APM, but limited on frontend CWV monitoring.
What to Monitor and When to Act
Set alerts at 80% of Google's thresholds as early warning signals:
- INP > 160ms — investigate before it crosses the 200ms threshold
- LCP > 2.0s — check for new unoptimized images or slow server responses
- CLS > 0.08 — look for newly added dynamic content or font loading issues
A Magento Performance Audit can establish your baseline and identify the highest-impact fixes. For deeper code-level issues, a Magento Code Audit will uncover technical debt affecting performance, from extension conflicts to inefficient database queries.
Summary
Even if you follow all the Core Web Vital requirements, the website loads fast and provides perfect UX, they immediately see the information on your page — but if that information isn't aligned with what Google assumes users are looking for, you won't be visible. So make sure that the webstore is perfectly technically structured and you have the right content that users need.
Key takeaways:
100% on Lighthouse doesn't mean your site passes CWV in the real world. Constantly monitor and rely on field data from real users.
FID is gone. INP is the new responsiveness metric since March 2024 — and it's much harder to pass. It measures ALL interactions, not just the first one. 43% of sites still fail it.
To pass Core Web Vitals, you don't need a 100% Performance score. You need to meet requirements for LCP (≤ 2.5s), INP (≤ 200ms), and CLS (≤ 0.1) for 75% of your real users. Don't chase a "green" score — prioritize these three metrics.
Hyvä Theme is the fastest path to CWV compliance for Magento stores. It eliminates the JavaScript bloat that causes most LCP and INP failures.
Monitor continuously. Use RUMvision or another RUM tool so you catch regressions in hours, not weeks.
It's not just developers — everyone on the team needs to understand how changes impact performance. Remember that any added script on the page will affect metrics. Don't add new features via Google Tag Manager without developer consultation. All added scripts should be added wisely and in proper order.
Ready to improve your Magento store's Core Web Vitals? Start with a free Magento Performance Audit — we'll identify exactly what's holding your store back and give you a prioritized roadmap.
FAQ: Core Web Vitals for Magento
What are the 3 Core Web Vitals in 2026?
The three Core Web Vitals are Largest Contentful Paint (LCP), which measures loading speed with a "good" threshold of 2.5 seconds or less; Interaction to Next Paint (INP), which measures responsiveness to user interactions with a "good" threshold of 200 milliseconds or less; and Cumulative Layout Shift (CLS), which measures visual stability with a "good" threshold of 0.1 or less. INP replaced First Input Delay (FID) as the responsiveness metric in March 2024.
What replaced FID (First Input Delay) in Core Web Vitals?
Interaction to Next Paint (INP) officially replaced FID as a Core Web Vital on March 12, 2024. The key difference: FID only measured the delay of the very first interaction on a page, while INP measures all user interactions throughout the entire visit and reports the worst representative interaction. This makes INP a much more comprehensive — and harder to pass — metric for responsiveness.
Does Hyvä Theme help pass Core Web Vitals?
Yes, significantly. 58% of Magento stores running Hyvä Theme pass all three Core Web Vitals, compared to an industry average below 20%. Hyvä achieves this by replacing Magento's heavy frontend stack (RequireJS, Knockout.js, UIComponents — 200+ files, ~1.5 MB) with Alpine.js and Tailwind CSS (just 2 files, ~0.2 MB). This dramatically improves both LCP and INP scores. See our Luma vs Hyvä performance benchmark for detailed numbers.
How do I check my Magento store's Core Web Vitals?
The easiest way is to enter your URL in PageSpeed Insights — look at the "Field Data" section (not the Lighthouse score) for your real CWV results. You can also check your full site status in Google Search Console under the Core Web Vitals report. For continuous monitoring, use a RUM (Real User Monitoring) tool like RUMvision which shows results in near real-time instead of CrUX's 28-day rolling average.
Why is my Magento store failing INP?
Magento stores commonly fail INP because of heavy JavaScript execution on the main thread. The default Luma theme loads 200+ JavaScript and CSS files that compete for main thread time during user interactions. Third-party scripts (analytics, A/B testing, chat widgets, consent management) add to the problem. Large DOM sizes on product and category pages slow down rendering after interactions. The most effective fix is migrating to Hyvä Theme, which eliminates the JavaScript bloat at the source.
Can I pass Core Web Vitals without migrating to Hyvä?
Yes, it's possible — but significantly harder and more time-consuming. You'd need to implement advanced JavaScript bundling (like Magepack), defer all non-critical scripts, optimize every third-party integration, reduce DOM size, and continuously monitor for regressions. Many agencies spend months fine-tuning Luma performance to pass CWV, while a Hyvä migration achieves better results in less time. Our Magento Performance Audit can help you evaluate both approaches for your specific store.
Do Core Web Vitals affect Magento store rankings?
Yes. Core Web Vitals have been a confirmed Google ranking factor since 2021, and their weight in the algorithm has only grown. While content relevancy remains the primary factor, for competitive queries where multiple sites offer similar content quality, the site with better page experience gains the advantage. Beyond direct ranking impact, better CWV scores correlate with lower bounce rates (up to 24% reduction), higher engagement, and increased conversions — all signals that indirectly boost rankings over time.